Twitch Case Studies
At a glance
My role
UX Design and Research Lead
Impact
Significant adoption (over 10%)
Stat sig suggestion usage and return visits
Learnings
New and up-and-coming creators are more flexible in content selection than we thought
User Need
“Variety Streamers” - or streamers who stream a multitude of games on Twitch rather than focusing on one or two - make up an overwhelming majority of new and up-and-coming creators on the platform. Creators want to stream content that is not only enjoyable and fulfilling to them, but also engaging to their community and beneficial in building a viewer base. Because of this, choosing what content to stream can often be a difficult and stressful process for newer creators.
This experiment aimed to ease that burden by presenting creators with metrics on their most recently streamed game, and similar games that are performing well - in this case, that is defined as having a high average viewer saturation per channel. We sought to answer three questions:
Do creators want this feature?
Will creators be able to find this feature and interact with it?
Will this module change user behavior - will they take our suggestions?
Research & Data
While creators on Twitch stream a gamut of content, including many non-gaming categories, we decided to focus on gaming content specifically for the following reasons:
99.8% of new creators on Twitch stream gaming content first
New and rising creators are the largest segment of variety streamers, defined by streaming 3 or more categories in the past 30 days.
66% of new creators
78% of new Affiliates (creators who are in the first phase of monetized content on Twitch)
Design Process
Low-fi Concepts
Our initial round of UXR consisted of presenting the below concept to users and asking for their feedback on it. These concepts included items with data visualization, education cards, table views, etc. in order to understand the best way users were able to interpret this information.
Feasibility Studies & Requirements
Following our initial concept work, we conducted a series of feasibility studies with our engineering partners to learn what was possible and not within this space. These studies resulted in the following product requirements:
Due to scope, we were unable to use any kind of data visualization on the cards
We were required to move forward with the card carousel, as it had been partially developed already. Changing to a table format was out of scope
The “Most Recent” card created added complexity for user education, as we could only pull their last streamed category on the back-end
This was especially true for variety streamers who would only see the last game they played, even if they played a few games over their entire last stream
Due to technical limitations, we could only filter by one genre at a time, but we could add a filter for broadcast language
We also got ample feedback from users during user testing which drove a list of design stories for the project, including (but not limited to):
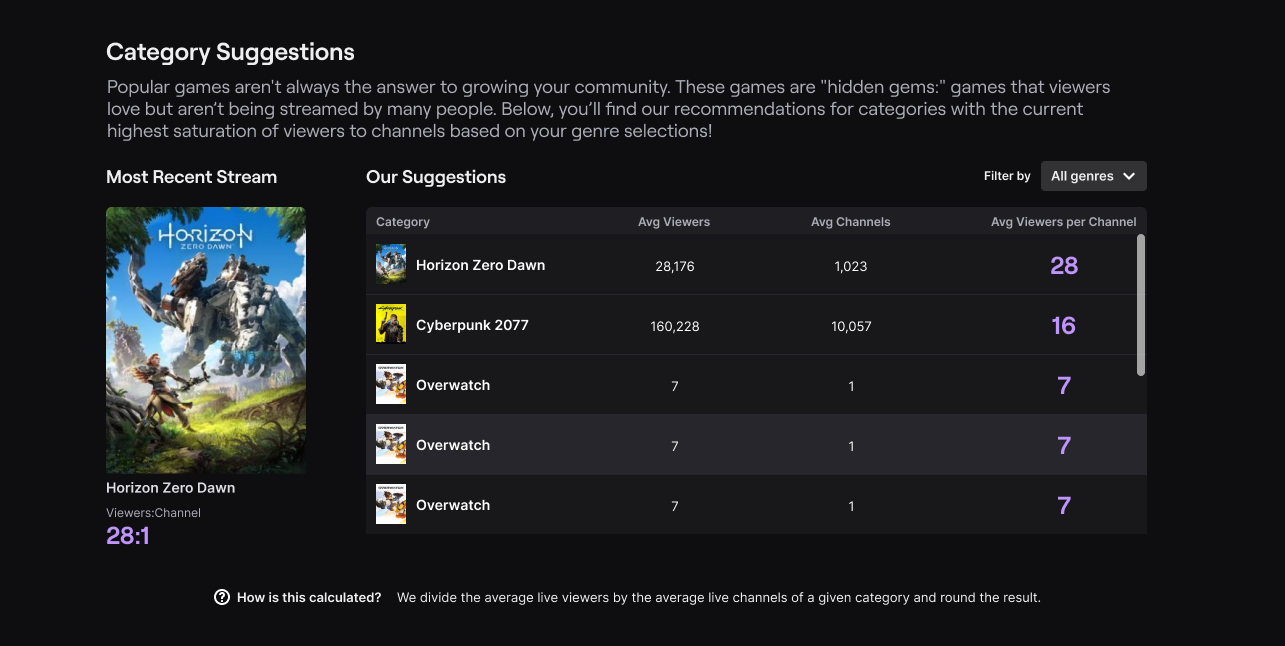
Users understood the metric best when we presented it as “Viewers:Channel” - no need for long explanations or on-screen division.
Users felt overwhelmed when we presented too much information, especially in terms of redundancy
Users often enjoyed browsing far beyond our original plan of 10 total cards, so we removed limitations on the number of cards in the carousel
Mid-Fidelity Explorations
Using the above inputs, I continued to explore the front-end experience in a series of mid-fidelity mockups.
Final Experience
Below is the final experience - following numerous rounds of feedback and testing - in context of the page it would be present on, called Stream Summary. This page is the summary of a user’s past broadcasts, which they may navigate at the top. Each page shows the user core performance analytics, and the Category Suggestions module was featured prominently in the first module position below the header metrics.
Outcomes & Looking Forward
Outcomes
The V1 experiment ran for 1.5 months, targeting a subset of new and up-and-coming creators that accounted for 33% of total creators. We saw statistically significant results on all our primary metrics, including:
Stream Summary return visits: +40 bps
Significant increases on Stream Summary CTR: +1175 bps
Suggested games streamed within 7 days: +62 bps
Due to its success, the tool is slated to be gradually rolled out to 100% of all creators.
Looking Forward
This product is being further developed with some exciting improvements that we were unable to scope for v1. This includes the addition of more category metrics, data visualizations for trends over time, and the ability to search and pin categories, or sort by games the creator owns. Check back for more soon!